Showing posts with label Economics. Show all posts

Sunday, November 22, 2015

Economics : Art Or Science

A controversial topic .

An economist David Rosenberg, former chief economist at Merrill Lynch once said , “Why did God invent economists?”
“To make weathermen feel good about themselves.”

There are some reasons for this statement.

Economics cant be considered as science as Science is a systematized body of knowledge ascertainable by observation 
and experiment. It is a body of generalizations, principles, theories or laws which traces out a casual relationship 
between causes and results.


Economics can define the causes and result but cannot do so with presicion.Just cause price of sugar increase by 1 dollar does not mean price of tea will increase by 1 dollar.

Again markets are frequently ahead of, and often out of sync with, the economy.economics follows
 the market but the market does not always follow economics .

Models are of limited utility.

correlation does not always mean causation.


There are two kinds of science:
Positive Science
Normative Science or Prescriptive Science

Some claim,

Economics is a positive science because:

Firstly, economists collect the facts.
Secondly, they analyze them and derive result.
Thirdly, they determine the relationship between facts and results.
Finally, they give a title to the relationship.

Economics is normative science because:

Firstly, economists points out different economic problems.
Secondly, they analyse them in the light of statistics or facts and figures.
Finally, they advise policies, laws, theories to solve the problems.
Economics is an art because:

Economists suggest policies along with their implementation procedures to solve the economic problem.

Thus, economics is a science as well as an art.


Thursday, October 15, 2015

Types of goods


Normal goods - the quantity demanded of such commodities increases as the consumer’s income increases and decreases as the consumer’s income decreases. Such goods are called normal goods.
Giffen goods - a Giffen good is an inferior good which people consume more of as price rises, violating the law of demand.. In the Giffen good situation, cheaper close substitutes are not available. Because of the lack of substitutes, the income effect dominates, leading people to buy more of the good, even as its price rises.
Substitutes goods- substitute good for another kind insofar as the two kinds of goods can be consumed or used in place of one another in at least some of their possible usesn increase in price for one kind of good (ceteris paribus) will result in an increase in demand for its substitute goods, and a decrease in price (ceteris paribus, again) will result in a decrease in demand for its substitutes.
Complementary goods - A complementary good or complement good in economics is a good which is consumed with another good;if goods A and B were complements, more of good A being bought would result in more of good B also being bought and vice versa eg car and Petrol. If the demand for car increases then the demand for petrol also increases.


Wednesday, October 14, 2015

Consumer surplus and price elasticity of demand

Consumer surplus and price elasticity of demand 

Inelastic Demand means fixed demand ( demand does not changes with a change in price).
When demand is inelastic, there is a greater potential of consumer surplus because there are some consumers who are willing to pay a higher price to consume that product. Whatever the price, the quantity demanded remains the same.
 
Inelastic Demand means consumers are willing to pay a higher price for buying the commodity.
Here,Consumers are willing to pay P1 for Q1 quantity of commodity.
But they actually pay P.
Here,triangle PP1AE is the consumer surplus.

Elastic Demand means flexible demand (demand changes with a change in price, law of demand follows).
When the demand for a good or service is perfectly elastic, consumer surplus is zero because with the increase in price of the commodity, the demand would decrease and vice versa. And would reduce the consumer surplus.
 
Here P is the the market price and
P1 is the price the consumer is willing to pay.
Now, suppose the price increases From P to Pn.
With the increase in price from P to Pn, Consumer surplus falls from PnPBA to PnPB1A1.

Elastic Demand means consumers are not willing to pay a higher price for buying the commodity.
With the increase in small Price, Demand will fall much more than proportion.
Here, Triangle PP1AB is the consumer surplus.

Change in Consumer Surplus: Price Increase
Consumer surplus = Amount a consumer is willing to pay – amount he actually pays


Tuesday, October 13, 2015

Consumer Surplus

Consumer surplus is a measure of the welfare that people gain from the consumption of goods and services with regard to the prices they pay for it.

Consumer surplus is the difference between the total amount that consumers are willing to pay and what they actually pay for a good or service (indicated by the demand curve) . Consumer surplus is a measure of welfare. 

The amount of consumer surplus can be derived from the demand curve. The price of a commodity is determined by the interaction of demand and supply curve. 


Consumers always like to feel like they are getting a good deal on the goods and services they buy and consumer surplus is simply an economic measure of this satisfaction. For example, assume a consumer goes out shopping for a CD player and he or she is willing to spend $250. When this individual finds that the player is on sale for $150, economists would say that this person has a consumer surplus of $100.


What is a Market?


A market is a place where buyers and sellers meet and interact. In today’s internet era, buyers and sellers don’t meet necessarily, but they interact and and perform their desired roles.
Market structure is best defined as the organisational and other characteristics of a market. There are some characteristics which affect the nature of competition and pricing.
The most important features of market structure are:
  • The number of firms.
  • The market share of the largest firms
  • The nature of costs
  • The degree to which the industry is integrated
  • The extent of product differentiation
  • The structure of buyers in the industry
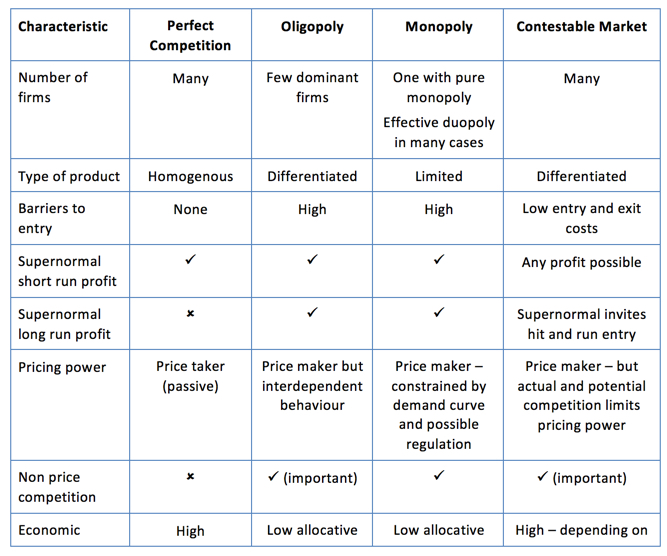
Summary of market structures


Changes in Market Equilibrium

Market equilibrium refers to a situation in which quantity demanded is equal to the quantity supplied, the point at which demand and supply curve meets. 

Increase in Supply results in a right ward shift in supply curve, leading to a new equilibrium point( the intersection point of demand and new supply curve.) 


· With the increase in supply, supply curve shifts rightward.
· The new equilibrium point is E1
· It would result in fall in prices and increase in quanity demanded.


Increase in demand results in a right ward shift in demand curve, leading to a new equilibrium point( the intersection point of demand and new supply curve.)
· With the increase in demand, demand curve shifts rightward.
· The new equilibrium point is E1
· It would result in rise in prices and increase in quanity demanded.

Simultanous Increase in demand and supply results in a right ward shift in demand curve and supply curve, leading to a new equilibrium point( the intersection point of demand and new supply curve). The changes in both demand and supply is a real market situation, The supply and demand curve changes as a result of change in market conditions.
· With the simultaneous increase in demand and supply, demand and supply curves shift rightward.
· The new equilibrium point is E1
· Here, It would result in rise in price P1 and increase in quanity demanded Q1.


Monday, October 12, 2015

Equilibrium Price


Equilibrium Price 
Equilibrium Price refers to the the market price at which the supply of an item equals thedemand of it. equilibrium is an important concept in economics. Equilibrium price is also referred as the equilibrium output.
Market equilibrium. 
Market equilibrium occurs where the amount consumers wish to purchase at a particular price is the same as the amount producers are willing to offer for sale at that price. It is the point at which there is no incentive for producers or consumers to change their behaviour.
Equilibrium price and output are found at the point of intersection of demand and the supply curve. 


Equilibrium Point is the Point where Quantity Demanded = Quantity supplied.
( Both quantity Demanded and quantity supplied are displayed on x-axis.)
Here, Pis the equilibrium price. At P1,
Quantity demanded = Quantity supplied.
D+S is the equilibrium level of quantity demanded and supplied
Example to Find out equilibrium Price
Given Demand and Supply functions are
Qd = 3P + 2 (1)
Qs = 10 - P (2)
In equilibrium, Qs = Qd.
And so, we can equate (1) and (2)
Qd = Qs
or 3P + 2 = 10 - P
or 3p + p = 10 - 2
or 4p =8 or p = 2
So, for the given equations, Equilibrium Price = 2
And to calculate the quantity Demanded, we will put the value of p in equation (1)
Qd = 3P + 2
= 3(2) + 2 = 8
And Qs = 8
And the equilibrium level of output is Qd = Qs = 8

Change in supply and Increase/decrease in quantity supplied

Movement and Shift in the Supply Curve 
Other things being equal, Supply of a commodity has a positive relationship with the price of the commodity

(Change)Movement in supply – movement in supply can be demonstrated as the change in quantity supplies as a result of change in price. Movement is along the same supply curve.

(Increase/ Decrease)Shift in supply - changes in other relevant factors other than price cause a shift in supply, that is, a shift of the supply curve to the left or right. Such a shift results in a change in quantity supplied for a given price level. If the change causes an increase in the quantity supplied at each price, the supply curve would shift to the right and if the change causes an decrease in the quantity supplied at each price, the supply curve would shift to the left.

 
Here. 
  • S = initial supply curve
  • D = initial demand curve
  • S1 = new supply curve
  • This new supply curve shows increase in supply at the same price.
  • It means factors other than price are responsible for an increase in supply.
  • Earlier at P1, Q D+S was supplied and now, due to change in factors, Qs1 is supplied.


Change in Demand and Increase/Decrease in quantity demanded

Movement and Shift in the Demand Curve

Other things being equal, Demand of a commodity has a negative relationship with the price of the commodity

(Change)Movement in Demand – Movement in demand can be demonstrated as the change in quantity demandedas a result of change in price. Movement is along the same demand curve. When price increases, demand decreases


( Increase/ Decrease)Shift in Demand - changes in other relevant factors other than price cause a shift in demand, that is, a shift of the demand curve to the left or right. Such a shift results in a change in quantity supplied for a given price level. Shift of the demand is called increase or decrease in demand. If the change causes an increase in the quantity demanded at the same price, the demand curve would shift to the right and if the change causes an decrease in the quantity demanded at the same price, the supply curve would shift to the left.
In the above curve, 
  • D = initial demand curve
  • S = initial supply curve
  • D1 = new demand curve
  • This new demand curve shows increase in demand at the same price.
  • It means factors other than price are responsible for an increase in demand.
  • Earlier at P1, Q D+S was demanded and now, due to change in factors, QD1 is demanded.

Law of Supply

The law of supply states that the higher the price, the larger the quantity supplied, all other things constant. The law of supply is demonstrated by the upward slope of the supply curve.

the supply curve often is approximated as a straight line to simplify analysis. A straight-line supply function would have the following structure:

Quantity = a + (b) Price
Quantity Supplied is a function of price.
where a and b are constant for each supply curve.

A change in price results in a change in quantity supplied and represents movement along the supply curve.

Law of supply can be understood with the following schedule and Curve.


According to law of Supply , " Quantity supplied increases with the increase in price".

Supply

Now that we know about demand its time we discuss about Supply .

Supply of a commodity can be defined as the amount of goods that producers are willing to supply / sell at a given price.
Supply and Price Price usually is a major determinant in the quantity supplied. In virtually all cases supply increases as price increases and vice versa.
This is because producers want to make profit. - If the good is sold at a high price they want more quantities of it to be sold and they will make
more profit.
- and if it is sold at a lower price they will either make very less profit or a loss.


Supply Schedule 


Supply curve shows the relationship between supply and price.

supply curve displays the quantity supplied on the x-axis as the independent variable and price on the y-axis as the dependent variable.

Sunday, October 11, 2015

Law of Demand

Law of demand states that all other factors being equal, as the price of a good or service increases, consumer demand for the good or service will decrease and vice versa. 

Here all other factors mean all the factors affecting demand. 
Law of demand explains the negative relationship and negative slope of demand curve


The demand curve slopes downwards due to the following reasons
(1) Substitution effect: When the price of a commodity falls, it becomes relatively cheaper than other substitute commodities. Thus, the quantity demanded of the commodity, whose price has fallen, rises.
(2) Income effect: With the fall in the price of a commodity, the consumer can buy more quantity of the commodity with his given income because as a result of a fall in the price of the commodity, consumer’s real income increases and so, the demand for the commodity. 
(3) Number of consumers: When price of a commodity is high, only few consumers can afford to buy it, And when its price falls, more numbers of consumers would start buying it. So, the total demand increases. 
(4) future expectations - When a consumer expects the prices of commodities to rise in near future, he starts making more demand and vice versa. E.g. when we expect that the prices of gas cylinder is going to rise after few days, we start making more demand at low prices. 
(5)Several uses of the commodity- When the price of a commodity falls, people start demanding more to put it into different uses Eg. Milk. When the price of milk falls, we start demanding more of it so as to make butter, sweets and curd etc. 
Exceptions to the law of Demand 
  • Inferior goods - Demand decreases with fall in price. Eg. - Dalda ghee
  • Articles of snob appeal - Demand increases with increase in prices. Eg. - Precious paintings and Jewellery
  • Emergencies- peaople demand more even at high prices in case of emergency.
  • Quality-price relationship - Quality concious people dont buy more at less prices.
  • Conspicuous necessities - Price demand relationship is not followed in case of necessities. Demand doesnot decreases with rise in prices for necessities.
  • Ignorance - Sometimes an unaware consumer thinks that if he will pay more, he will get better.
  • Change in fashion, habits, attitudes - If a product goes out of fashion or people start disliking it. Its demand doesnt increase even with a fall in price.

Market Demand

Supply curve shows the relationship between supply and price.


supply curve displays the quantity supplied on the x-axis as the independent variable and price on the y-axis as the dependent variable.

1. Supply curve shows the relationship between supply and price.

2. Supply curve displays the quantity supplied on the x-axis as the independent 
variable and price on the y-axis as the dependent variable.


What is Demand ?


Goods are demanded because of their utility 


What is a Want: The basis of all economic activities is the existence of human wants and the process of fulfillment of this want is the base of economic activity.
Desire/ Want : 
“Desire is the wish to have something. But ‘want’ is an effective desire for a particular thing, which can be satisfied by making an effort to acquire it.

Want can be used for demand but Desire can not be.
Demand
Definition - Demand may be defined as the amount of the commodity an individual is willing to buy at a particular price and at a particular time.
q = f(p) It means quantity demanded is a function of Price
Here q= quantity demanded and P = price of the commodity.

The relationship between demand and Price can be understood by -


The above table represented in the form of graph is called Demand curve


The Demand curve states a negative relationship between price and quantity demanded.
As the price decreases, the quantity demanded increases and vice versa.


FACTORS affecting DEMAND
· Change in consumer tastes
· Change in the number of buyers
· Change in consumer incomes
· Change in the prices of complementary and substitute goods
· Change in consumer expectations


What is Economics?

Economics is the study of an economy.
An economy can be a small household economy, a business economy, a state economy or a national economy.

To understand economics, let’s take an example of a household economy.

In a house:
  • One or two persons earn (Income of the household)
  • Every member spends (Consumption)
  • Income is divided according to one' needs (distribution)

Let us elaborate this example-
  • Suppose the total income of the household is Rs. 10,000. and this 10,000 Rs need to be divided in to so many parts.
  • Our basic needs are to be fulfilled first, Food, Basic Clothing and shelter, Education, Utility bills.
Mr. X spends

  • 2000 - Food items
  • 1000- Milk
  • 2000- Electricity, Cable and other bills
  • 500- Petrol
  • 2000- Savings Deposit
  • 2000- School fees including books expenses
  • 500- Kids clothes

· And suppose some wedding comes in the family or his kids demand to go for a picnic or his wife wants a new dress, new jewellery or he, himself needs a new scooter, anything, one can demand anything, kids might want a new toy.

Now his expenses are more than his income, what he can do is

  • Not to Save.- Buy less food.
  • Do overtime and earn more.
  • Withdraw from his savings.
  • Borrow the money from someone
He cannot reduce his kids’ school's expenses(necessities).

there is one important aspect which is also related to economics is Social welfare. As a parent, Mr. X cant fulfill just one member's demand. He has to take care that all members’ needs should be satisfied.

So, in the above example,
His income is limited, but his wants are unlimited.
And How he allocates his limited income into unlimited wants according to his priorities.
This is economics. so, economics is the science which describes human behavior as a relationship between (given) ends and scarce means which have alternative uses. In simple words, our means are limited but our wants are unlimited , so we have to make a choice that what wants need to be fulfilled.

This was an example of an individual economy,from the same example we can learn another definition of economics which defines economics as the science that deals with the production, distribution, and consumption of wealth here.

  • Production - How One Generates Income.
  • Distribution- How He Allocates Income To Different Needs And Wants Consumption- How To Consume

* * In economics production is related to productivity ( not only in terms of output of an industry, but also in terms of value of output and services i.e. income) E.g. a teacher's income is his production.

Now with the same example we can learn about a nation's economics.

For a country, its total income is the total income of all people of the country.
Government decides how to distribute its income according to country's needs.
Spend on infrastructure or development or defense.
The same way Government t also feels that its resources are limited.
Government also keeps in mind the social welfare concept; it just can’t spend for the development of one sector or one group only.
Government also finds out ways to increase its income so that its max needs can be fulfilled. And when it falls short of money, it borrows money or depends on one or the other way of income generation. So, This is economic.